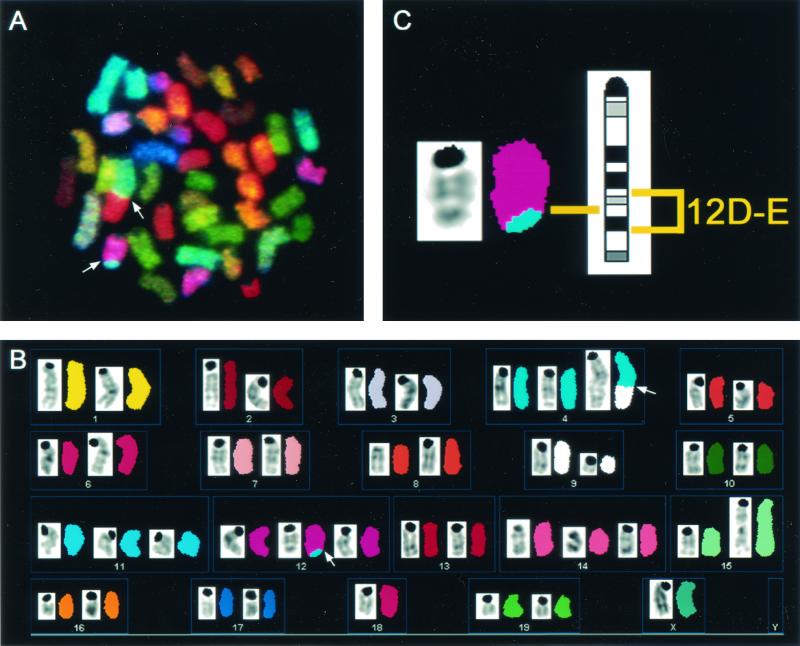
FIG. 2.
Spectral karyotyping analysis of a metaphase cell from Rag1−/− Atm−/− thymic lymphoma no. 20154 displaying chromosome aberrations. The entire metaphase is shown in display colors in panel A, with arrows indicating translocated chromosomes. The spectrum-based classification karyotype is shown in panel B, with each pseudocolored chromosome positioned next to its inverted 4′,6′-diamidino-2-phenylindole-banded image. The T(12;4) is enlarged in panel C next to the G-band ideogram for chromosome 12, to highlight the band region involved in the translocation. The full karyotype of this metaphase is 42, X, T(4D;9A), Del(9B-F), T(12D-E;4D), Dp(15B-D), +4, +11, +12, +14, −18, −Y. Note that this representative metaphase for tumor no. 20154 does not contain every clonal aberration that is described in Table 1.

