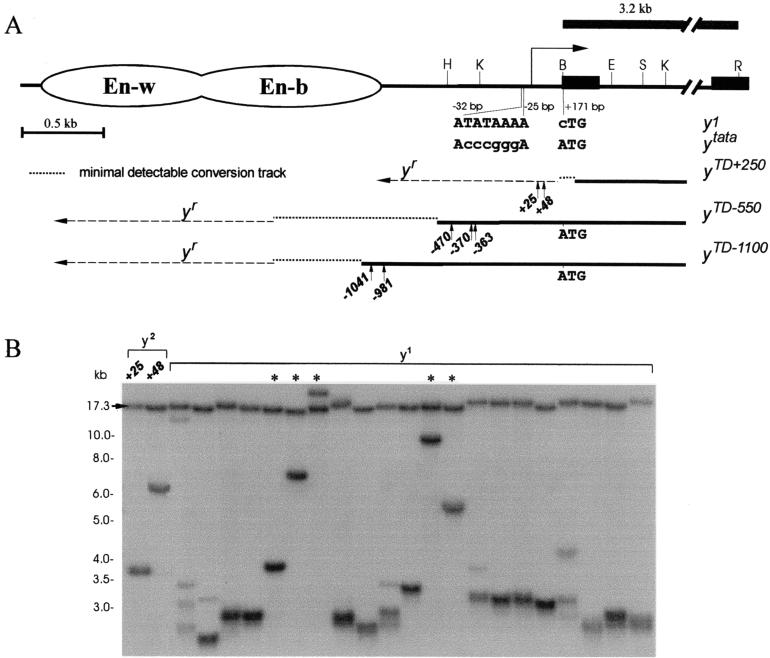
FIG. 4.
The model system to study terminal DNA elongation by gene conversion on the Su(var)2-5 mutant background in the presence of a template on the homologous chromosome. (A) Schematic presentation of the terminal yellow deficiencies associated with different y alleles. The molecular structures of the y1 and ytata mutations are shown. The wing (En-w) and body (En-b) enhancers are indicated by ovoids. The approximate regions of the ends of terminally truncated chromosomes in the yTD alleles are shown by three thin horizontal black lines. The dotted horizontal lines show the regions of yellow sequence in which the termini of yTD line with original phenotype have been mapped. The dashed horizontal lines show the regions of yellow sequence in which the termini of yTD line acquiring a new y phenotype have been mapped. The 3.2-kb BamHI-EcoRI genomic fragment used as a probe for Southern blot analysis is indicated by the uppermost thick line. The HeT-A attachment points are shown by small vertical arrows below each of the three thin horizontal black lines. The sequences at the junctions between yellow and HeT-A are shown in Fig. 3. Other designations are as defined in the Fig. 1 legend. (B) Southern blot analysis of DNAs prepared from F2 progeny of individual yTD+250/ytataw; Su(var)2-5/CyO flies. DNAs were digested with EcoRI. The filter was hybridized with the 3.2-kb BamHI-EcoRI probe. The 17.3-kb band corresponds to the DNA fragment between two EcoRI sites in the ytata allele. Asterisks indicate yTD lines displaying a y1-like phenotype that acquired new DNA attachments. The presence of additional bands indicates the heterogeneity of the progeny, suggesting that in some sisters, terminally truncated chromosomes acquired new DNA sequences (HeT-A or TART).

