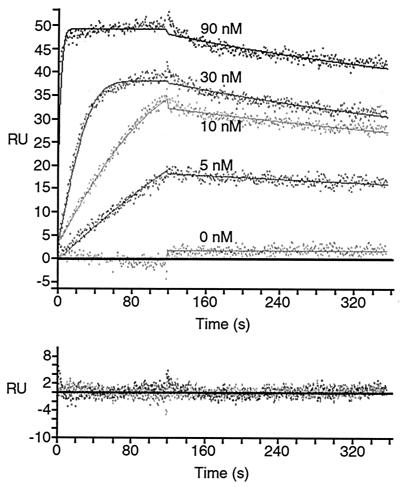
FIG. 5.
SPR analysis of the interaction between PABP(RRM1-4) and Paip1. PABP(RRM1-4) was injected, at the concentrations indicated, over a Paip1 surface (100 RU) and over a mock surface. Data were treated and integrated with a simple 1:1 model. (Top panel) Experimental sensorgrams (points) and calculated fits (solid lines). (Bottom panel) Related residuals (difference between calculated and experimental data points). Related kinetic constants are listed in Table 1.

