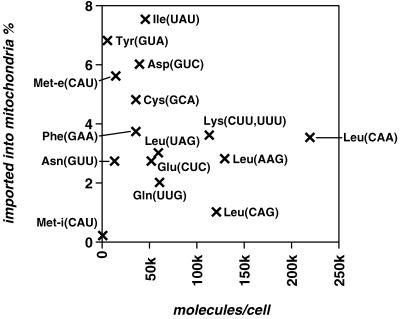
FIG. 4.
tRNA abundance in total cell and mitochondria. This is a graphical representation of the results shown in Table 3. The numbers of tRNA molecules per cell were plotted against the percentage of those found in mitochondria. Identities of the tRNAs and their anticodons are indicated. No correlation between expression level and extent of mitochondrial localization was observed (R = −0.29, P = 0.310).

