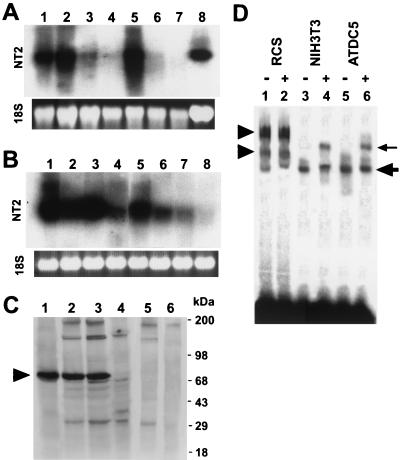
FIG. 2.
mRNA and protein expressions of NT2 in various tissues and cell types. (A) Analysis of NT2 expression in newborn mouse tissues by Northern blotting. For each lane, 20 μg of total RNA from various tissues was loaded, transferred to the nylon membrane, and hybridized with labeled NT2 cDNA. NT2 mRNA was strongly expressed in the brain, thymus, spleen, and rib cartilage. Lane 1, brain; lane 2, thymus; lane 3, heart; lane 4, liver; lane 5, spleen; lane 6, kidney; lane 7, skeletal muscle; lane 8, rib cartilage. (B) Total RNA (20 μg/lane) extracted from various cells was analyzed by Northern blotting using the NT2 cDNA probe. NT2 mRNA was highly expressed in BALB/3T3, 10T1/2, undifferentiated ATDC5, and MC3T3 cells (ATDC5 is a chondrocytic cell line and MC3T3 is an osteoblastic cell line), whereas low expression was seen with RCS cells (RCS is a rat chondrosarcoma cell line). Lane 1, BALB/3T3; lane 2, 10T1/2; lane 3, undifferentiated ATDC5; lane 4, RCS; lane 5, MC3T3; lane 6, ROS17/2.7; lane 7, L6; lane 8, C2C12. The lower panels show ethidium bromide-stained gels. (C) Western blot analysis of NT2 protein expression in cell lines. Nuclear extracts (2 μg) from cells were fractionated by SDS-PAGE, blotted, and incubated with NT2 antibodies. In vitro-translated NT2 (2 μg) was also subjected to Western blot analysis. To show the specificity of NT2 antibodies, the antibodies with NT2 reactivity depleted by NT2-Sepharose affinity column chromatography were also used as a control (ΔNT2 antibody). Lane 1, in vitro-translated NT2; lane 2, NIH 3T3; lane 3, undifferentiated ATDC5; lane 4, RCS; lane 5, NIH 3T3 with ΔNT2 antibody; lane 6, undifferentiated ATDC5 with ΔNT2 antibody. Protein standards are indicated on the left. The arrowhead indicates the NTZ protein band. (D) DNA binding of NT2 in cells to the labeled wild-type Col11a2 promoter. The 24-bp DNA sequence CAGGGAGGAGGGAGAGCGGCTGCT was used to prepare a double-stranded probe. EMSAs were performed with nuclear extracts from RCS (lanes 1 and 2), NIH 3T3 (lanes 3 and 4), and undifferentiated ATDC5 (lanes 5 and 6) cells. The presence (+) or absence (−) of antibodies against NT2 is indicated. The large arrow indicates NT2-promoter complexes (lanes 3 and 5). The small arrow marks supershifted NT2-promoter complexes by the anti-NT2 antibodies (lanes 4 and 6). The arrowheads indicate RCS cell-specific protein-promoter complexes (lanes 1 and 2). These complexes are specific to RCS cells and are not found in either NIH 3T3 or undifferentiated ATDC5 cells and are not supershifted by anti-NT2 antibodies.

