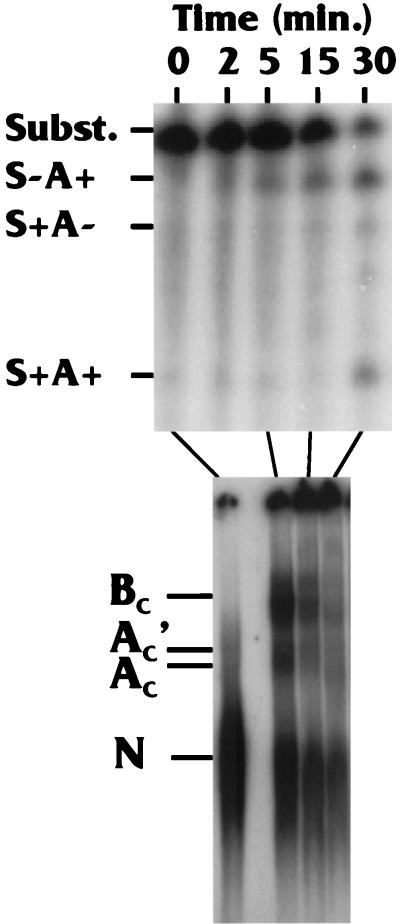
FIG. 4.
Comparison of the rate of complex formation with the appearance of spliced and polyadenylated products. Reaction mixtures were split in half, with one-half being used for complex formation analysis and the other being analyzed for processing products: polyadenylated but not spliced (S−A+); spliced but not polyadenylated (S+A−); and spliced and polyadenylated (S+A+), which represents the fully processed product. See the text for details.

