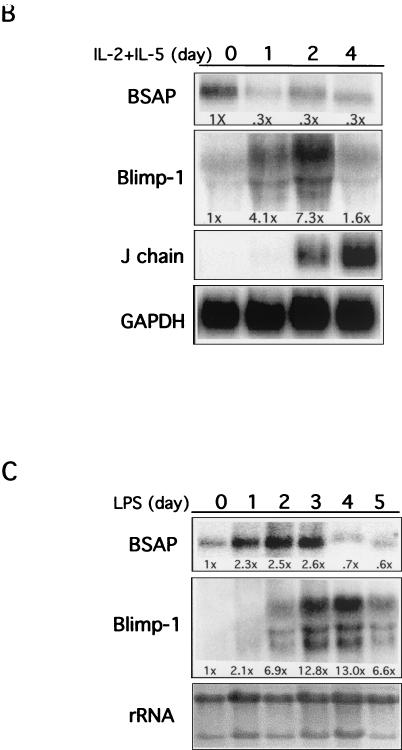
FIG. 1.
Expression of Blimp-1 and BSAP. (A) Blimp-1 and BSAP in tonsillar B cells. Fluorescent nuclear staining for Blimp-1 in green (a and c) and for BSAP in red (b and d), with merged images in the center. Germinal centers (GC), extrafollicular areas (EFA), and the mantle zone (MZ) are indicated. Magnifications: a and b, ×10; c and d, ×40. A cluster of Blimp-1+ plasma cells (PC) (left, boxed) and Blimp-1+ squamous epithelial cells (SE) (upper right) are indicated. (B) A total of 107 BCL-1 cells, growing in log phase, were stimulated with the cytokines IL-2 and IL-5. At the indicated times, cells were harvested, and the total RNA was prepared and analyzed by Northern blotting. GAPDH was used as the internal control. The fold changes in BSAP and Blimp-1 RNA, normalized to GAPDH, are shown under each lane. The fold change in J chain was not quantitated since no mRNA was measurable prior to treatment. (C) Splenocytes were stimulated with LPS (10 μg/ml) for 0 to 5 days, and RNA was analyzed by Northern blotting at the indicated times. 28S and 18S rRNA stained with ethidium bromide were used as loading controls. The fold changes, normalized to 28S rRNA, are shown below each lane.


