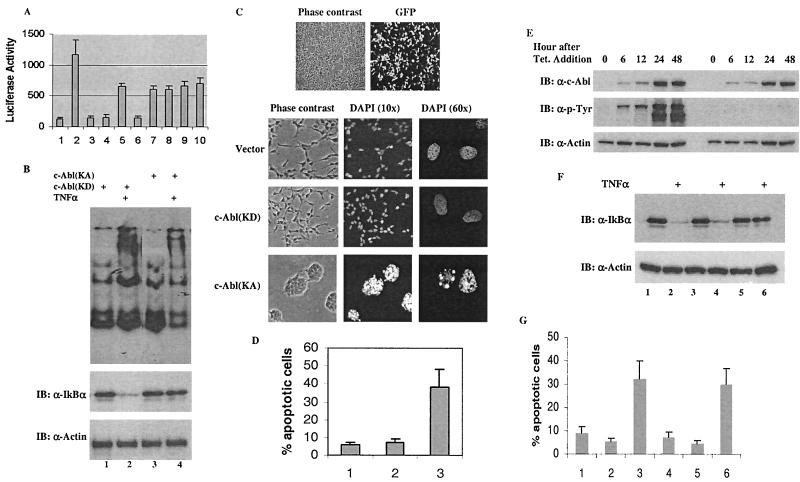
FIG. 6.
Functional inhibition of NF-κB contributes to the proapoptotic function of c-Abl. (A) A luciferase-expressing vector containing a κB-responsive element was cotransfected with control vectors (bar 1), NF-κB/control vector (bar 2), c-Abl(KA) (bar 3) or c-Abl(KD) (bar 4), NF-κB/IκBα (bar 5), NF-κB/IκBα/c-Abl(KA) (bar 6), NF-κB/IκBα/c-Abl(KD) (bar 7), NF-κB/IκBα(Y305F) (bar 8), NF-κB/IκBα(Y305F)/c-Abl(KA) (bar 9), or NF-κB/IκBα(Y305F)/c-Abl(KD) (bar 10). pRL-TK vector (Promega) was included to control the low level of Renilla luciferase expression and serve as a transfection efficiency control. Luciferase assays were performed 24 h posttransfection using the Promega Rapid Detection system. Values are averages ± SE of the mean derived from two separate experiments performed in triplicate. (B) Cells expressing c-Abl(KD) (lanes 1 and 2) or c-Abl(KA) (lanes 3 and 4) were treated with TNF-α (10 ng/ml) for 15 min (lanes 2 and 4) or left untreated (lanes 1 and 3). Nuclear extracts were prepared for EMSA using a labeled consensus NF-κB-binding oligonucleotide (top panel) and whole-cell extracts were analyzed by Western blotting using anti-IκBα and anti-actin (lower panels). (C) 293T cells were transfected with 2 μg of GFP-c-Abl(KD) and the cells were visualized via phase-contrast optics (left) and fluorescent filter (right) to show transfection efficiency. Cells expressing a control vector (2 μg; top panels), c-Abl(KD) (2 μg; middle panels) or c-Abl(KA) (2 μg; bottom panels) were treated with TNF-α (40 ng/ml) at 16 h posttransfection. After incubation at 37°C for an additional 8 h, the cells were fixed and stained with DAPI. The whole cells were visualized by phase-contrast optics and the nuclei were visualized by UV optics (two different amplifications, 10× or 60×). (D) Cells expressing a control vector (bar 1), c-Abl(KD) (bar 2) or c-Abl(KA) (bar 3) were processed as described for panel C. The cells were then fixed in 70% methanol, stained with PI and subjected to FACS analysis. Sub-G1 populations were recorded as the apoptotic cells. Values are averages ± SE of the mean derived from two separate experiments performed in triplicate. (E) The pooled cell populations that stably expressed c-Abl(KA) or c-Abl(KD) were treated with tetracycline (1 μg/ml) and harvested at the indicated times for Western analysis with anti-c-Abl (top), anti-p-Tyr (middle) or anti-actin (bottom). (F) At 24 h postaddition of tetracycline, cells expressing the control vector (lanes 1 and 2), c-Abl(KD) (lanes 3 and 4) and c-Abl(KA) (lanes 5 and 6) were treated with TNF-α (10 ng/ml) for 15 min and the cell lysates were subjected to Western analysis. (G) After induction with tetracycline for 12 h, cells that expressed the control vector (bars 1 and 4), c-Abl(KD) (bars 2 and 5) or c-Abl(KA) (bars 3 and 6) were treated with TNF-α (40 ng/ml) (bars 1 to 3) or UV (20 J/m2) (bars 4 to 6). The cells were harvested (8 h after addition of TNF-α or 24 h after UV treatment) for FACS analysis as described for panel D.

