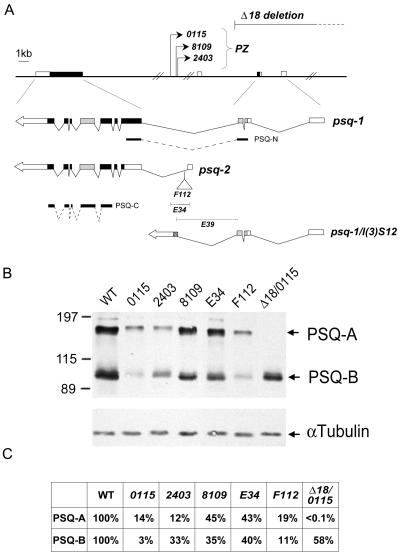
FIG. 7.
Relative abundance of Psq proteins in ovaries of psq mutants. (A) A map of the psq locus is redrawn on the basis of the information from Horowitz and Berg (27) and Weber et al. (61). The genomic structure of psq and the positions of class I mutations including three PZ insertion mutants (0115, 2403, and 8109) and a deletion mutant (Δ18) are shown above the map. The structures of two major cDNAs, psq-1 and psq-2, are shown below, with their splicing junctions indicated. The noncoding sequences (blank boxes) and the coding regions (solid boxes), including the N-terminal BTB (stippled boxes) and C-terminal PSQ domains (grey boxes), are also shown. Three class II mutations, F112, E34, and E39, are located around the first exon of psq-2. The approximate sites of insertion (F112) or deletion (E34 and E39) are indicated. psq-1/l(3)S12 represents a fusion product resulting from an aberrant splicing between psq-1 and l(3)S12 adventitiously present in the PZ transposons. The positions of two recombinant proteins, PSQ-N and PSQ-C, used for antibody purification are also indicated. The DNA fragments are drawn to scale except for the ∼40-kb intron. (B) Protein analysis of psq mutants. Ovaries were dissected from homozygous psq or transheterozygous mutant adults, and proteins were analyzed by SDS-polyacrylamide gel electrophoresis. psq proteins were detected with affinity-purified antibody against PSQ-C. Extracts derived from wild-type (WT) or mutants are indicated above the respective lanes. Homozygous psqE39 animals died during pupation. The positions for PSQ-A, PSQ-B, and an internal control (α-tubulin) are marked by arrows. The positions of mass markers (in kilodaltons) are marked. Note that trace amounts of PSQ-A could be detected in psqΔ18/psq0115 mutants when the film was exposed for a longer amount of time. (C) Relative abundance of psq proteins. The relative amounts of PSQ-A and PSQ-B in these mutants are derived by first calibrating against the internal control (i.e., α-tubulin) in each sample. Each value was then calculated by using wild-type proteins as references.

