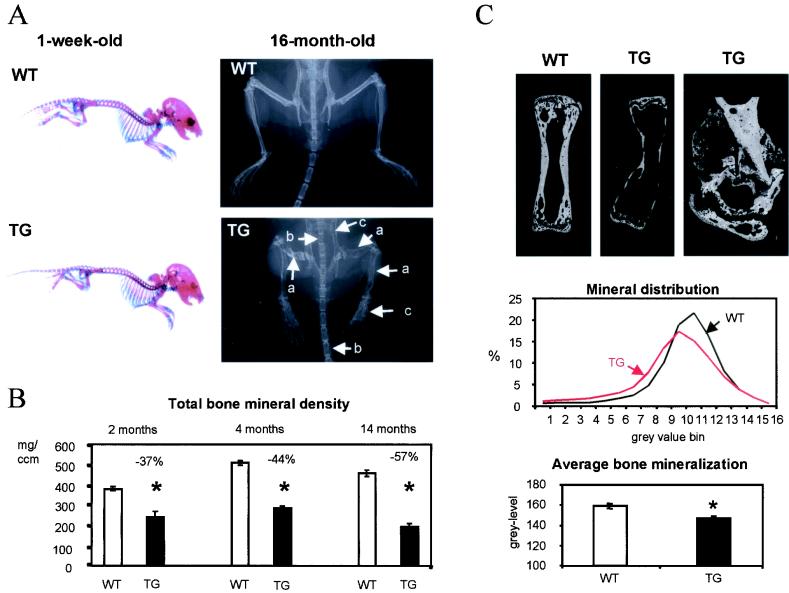
FIG. 2.
Radiological analysis and mineralization parameters of Cbfa1-overexpressing mice. (A) Skeletal preparation of 1-week-old wild-type (WT) or Cbfa1-overexpressing (TG) mice, followed by Inouye's staining (left panels) and X-ray analysis of 16-month-old wild-type and Cbfa1-overexpressing mice (right panels). At 1 week of age, Cbfa1-overexpressing mice exhibited normal distribution of bone and cartilage tissues, but at 16 months of age, Cbfa1-overexpressing mice exhibited smaller stature and dramatically lower cortical thickness and mineral density (white arrows), which induced multiple fractures in the appendicular (a) and central (b) skeleton and resulted in widened and/or misshapen bone structures (c). Arrows indicate different sites of fracture or bone structure alteration. (B) Total bone mineral density measured in proximal tibia from Cbfa1-overexpressing mice (TG) and their wild-type littermates (WT) at 2, 4, and 14 months of age. The phenotype did not improve with increasing age. (C) BSE images of tail vertebrae from 4-month-old Cbfa1-overexpressing mice (TG) (top middle and top right panels) and from a wild-type littermate (WT) (top left panel). The bone mineralization characteristics, as measured by quantitative BSE imaging, show that the bone mineralization profile (center panel) is shifted towards lower densities in Cbfa1-overexpressing mice (red line) compared to that of wild-type mice (black line) and that the average level of bone mineralization (bottom panel) is reduced in 4-month-old Cbfa1-overexpressing mice (black bar) compared to that of their wild-type littermates (open bar). Magnification of a vertebral fracture site in transgenic mice is presented in the top three panels. The fracture-healing process was normal in transgenic mice, as calcified cartilage was produced normally. Bars represent means ± SEM; statistically significant differences between wild-type and transgenic mice are represented by stars (P < 0.05 by Student 's t test [n = 5 for TG; n = 10 for WT]).

