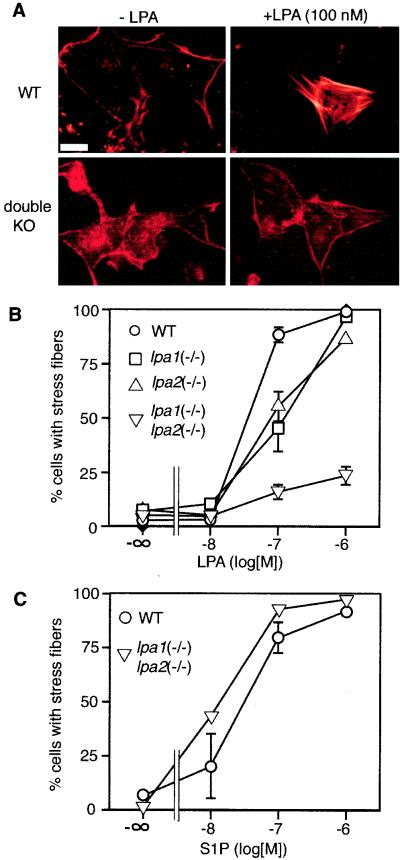
FIG. 8.
LPA-induced stress fiber formation in MEMF cells. (A) Fluorescence microscopy of TRITC-phalloidin-stained wild-type (WT) and lpa1(−/−) lpa2(−/−) double knockout (double KO) meningeal fibroblast cells, either without stimulation (left) or after 15 min of stimulation with 100 nM LPA (right). (B) Percentages of wild-type (WT), lpa1(−/−) single, lpa2(−/−) single, and lpa1(−/−) lpa2(−/−) double knockout meningeal fibroblasts with actin stress fibers after stimulation with increasing concentrations of LPA. (C) Percentages of wild-type (WT) and lpa1(−/−) lpa2(−/−) double knockout meningeal fibroblasts with actin stress fibers after stimulation with increasing concentrations of S1P. Data shown are the means ± standard errors of triplicate samples. Bar, 10 μm.

