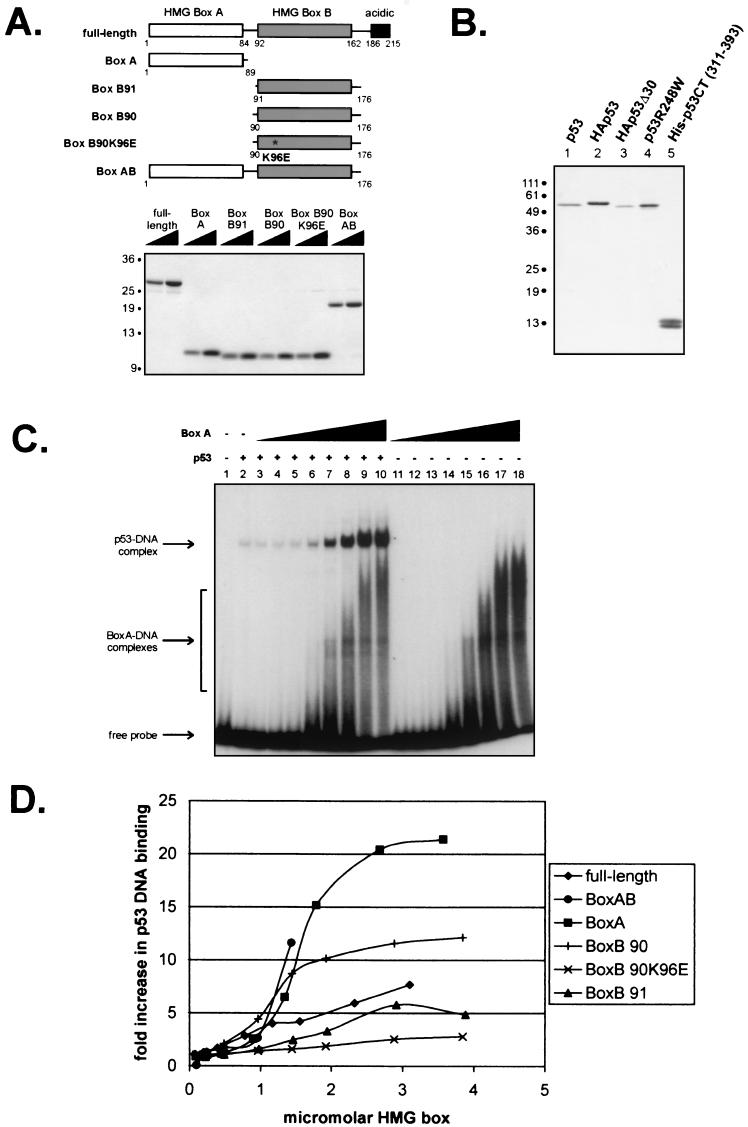
FIG.1.
Isolated HMG boxes efficiently increase p53 DNA binding. (A) Schematic diagram and Coomassie blue-stained gel of purified six-histidine-tagged full-length and truncated mutant forms of HMGB1. (B) Silver-stained gel of immunopurified wild-type and mutant p53 proteins. (C) Representative autoradiogram of an EMSA showing the effects of increasing concentrations of HMGB1 box A (0.09, 0.22, 0.45, 0.89, 1.34, 1.79, 2.68, and 3.57 μM [lanes 3 to 10 and lanes 11 to 18, respectively]) on the binding of p53 (8.5 nM) to a 32-bp oligonucleotide containing the GADD45 p53 binding site. (D) Graphic summary of the effects of the different forms of HMG1B shown in panel A on p53 DNA binding, as determined by EMSA. The units on the x axis take into account the fact that the full-length and box AB constructs have two DNA binding motifs per molecule. The curve for HMG1B box AB terminates at 1.4 μM HMG box because at higher concentrations, this construct bound the labeled DNA probe so well that it obscured the region containing the p53-DNA complex on gels.

