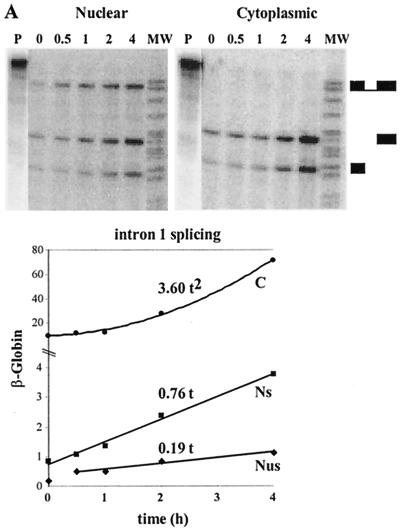
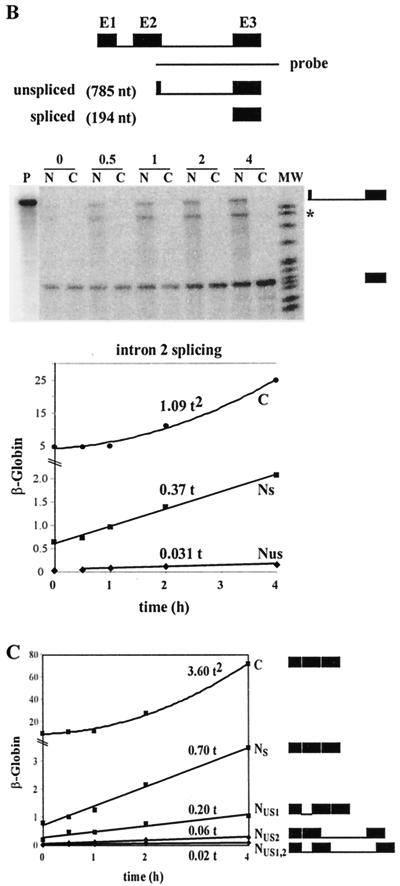
FIG. 7.
Determination of β-globin splicing and transport rates during a short-term induction by using a polynomial description. (A) Intron 1 splicing rate and transport rate. HeLa-β-glo cells were treated with 2 μg of doxycycline/ml for up to 4 h. β-Globin transcripts were analyzed by RNase protection assay with the probe encompassing intron 1, as in Fig. 4. Nuclear spliced (NS) and unspliced (NUS) and cytoplasmic (C) transcripts were plotted as a function of time. Curve-fitting functions, linear for NS and NUS and binomial for C, were applied to the data. The best fits (lines) are displayed, the first term of the equation being indicated above. The correlation coefficients of the binomial fittings are indicated in Materials and Methods. (B) Intron 2 splicing rate and transport rate. The same samples were analyzed by RNase protection assay with a β-globin probe encompassing intron 2. The principle of the protection by spliced and unspliced transcripts is shown schematically at the top. Migration of the protected fragments is indicated at the right of the gel. ∗, migration expected for released linear intron 2. The experimental results and their fit by linear and binomial curves were plotted as for panel A. (C) Combined quantification of all the nuclear and cytoplasmic β-globin transcripts. The ratio between intron 2 unspliced and spliced RNA measured in panel B was used to calculate their participation to intron 1 unspliced and spliced RNA in panel A. These data and their curve fits were plotted as in panel A. The structure of all RNA species is shown on the right.


