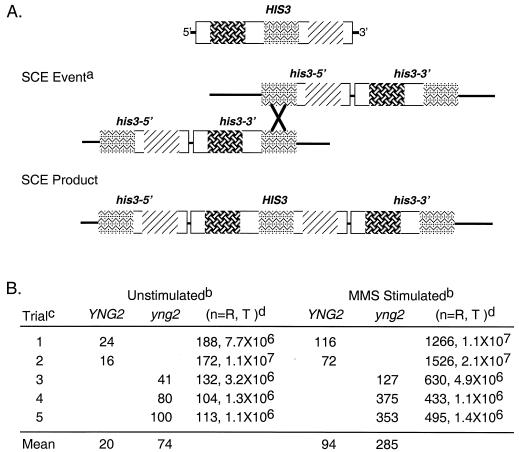
FIG. 9.
yng2 mutants are proficient in SCE-mediated recombination. (A) Diagram showing the physical arrangement of the his3 alleles (his3-3′ is truncated at the C terminus and his3-5′ is truncated at the N terminus) and the predicted SCE event which gives rise to a wild-type structure of HIS3 conferring histidine prototrophy. (B) Asynchronously growing YNG2 and yng2 mutant cells containing the construct shown in panel A were left untreated (unstimulated) or treated with sublethal levels of MMS (MMS stimulated). The frequency of recombination events was determined based on the number of colonies formed on SC-His relative to the total number of cells plated. YNG2 and yng2 mutants display a similar frequency of induced SCE events (relative to unstimulated, fivefold, and fourfold increase, respectively, based on the mean). Note the ∼fourfold increase in mean unstimulated recombinants for yng2 mutants (unstimulated) relative to results for YNG2 cells. Footnote a, SCE event illustrates a predicted recombination event between two sister chromatids at a region of homology between his3-5 and his3-3: the recombination product (SCE product) on one sister chromatid. Footnote b, unstimulated indicates that cells were asynchronously growing in liquid medium before plating, and MMS Stimulated indicates that asynchronously growing cells were treated for 1 h with MMS and then plated. The number of colonies formed on SC-His plates (indicative of SCE events) per million cells plated is shown for each trial. Footnote c, trials 1 and 2 were performed with the same YNG2 isolate, whereas in each trial for yng2 (trials 3 to 5), independent yng2 mutant isolates were used. Footnote d, (n=R, T) represents the number of recombinants (R) (colonies formed on SC-His plates) and the total (T) number of cells plated.

