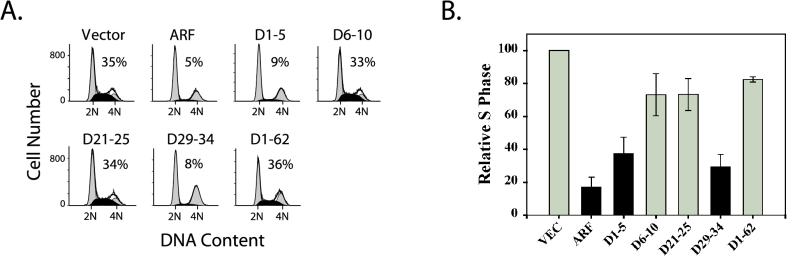
FIG. 2.
Analysis of cell cycle distributions in fibroblasts expressing ARF mutants. ARF-null NIH 3T3-D1 cells were infected with bicistronic retroviruses encoding the cell surface protein, CD8 (vector), or CD8 plus wild-type mouse ARF or the different ARF deletion mutants, as indicated. The DNA content of successfully infected (CD8-positive) cells was analyzed 2 days after infection by dual-color flow cytometry. (A) Histograms from a representative experiment showing G1 and G2/M populations shaded in gray and S-phase cells highlighted in black. The percentage of cells in S phase is noted within each histogram. (B) The relative percent S phase for cells expressing ARF or its mutants was calculated relative to the vector control. Each value represents the mean and its standard deviation from at least three independent experiments.

