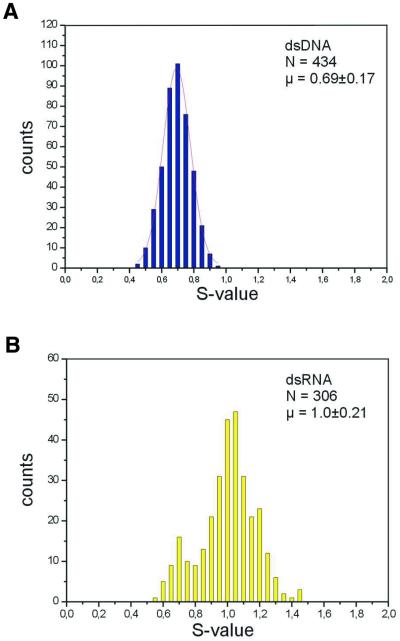
Figure 3.
S-factors for (A) dsDNA and (B) dsRNA. The diagrams show the number of measurements generating specific S-factors. The small peak in the dsRNA diagram at 0.7 corresponds exactly to the S-factor of dsDNA and is most likely due to a DNA contamination in the preparation. S-factors were calculated as described in the Materials and Methods.

