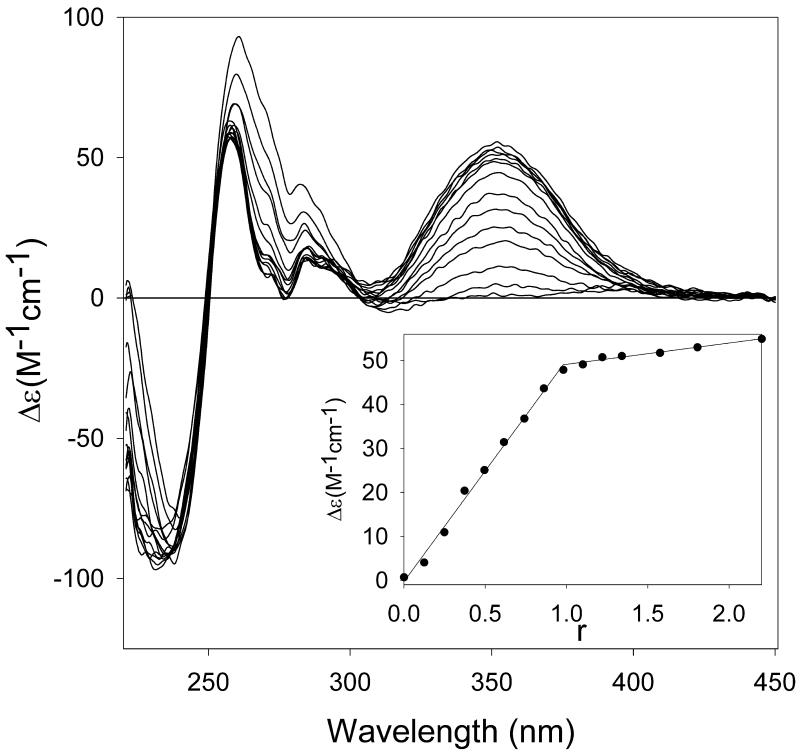
Figure 4.
Titration of the ATAT duplex with Hoechst 33258 monitored by circular dichroism. The band centered at 355 nm is attributed to the complex with the drug and the change in ellipticity at this wavelength as a function of the drug/duplex fraction r is plotted in the inset. An inflexion point is observed for r = 1 (1:1 complex).

