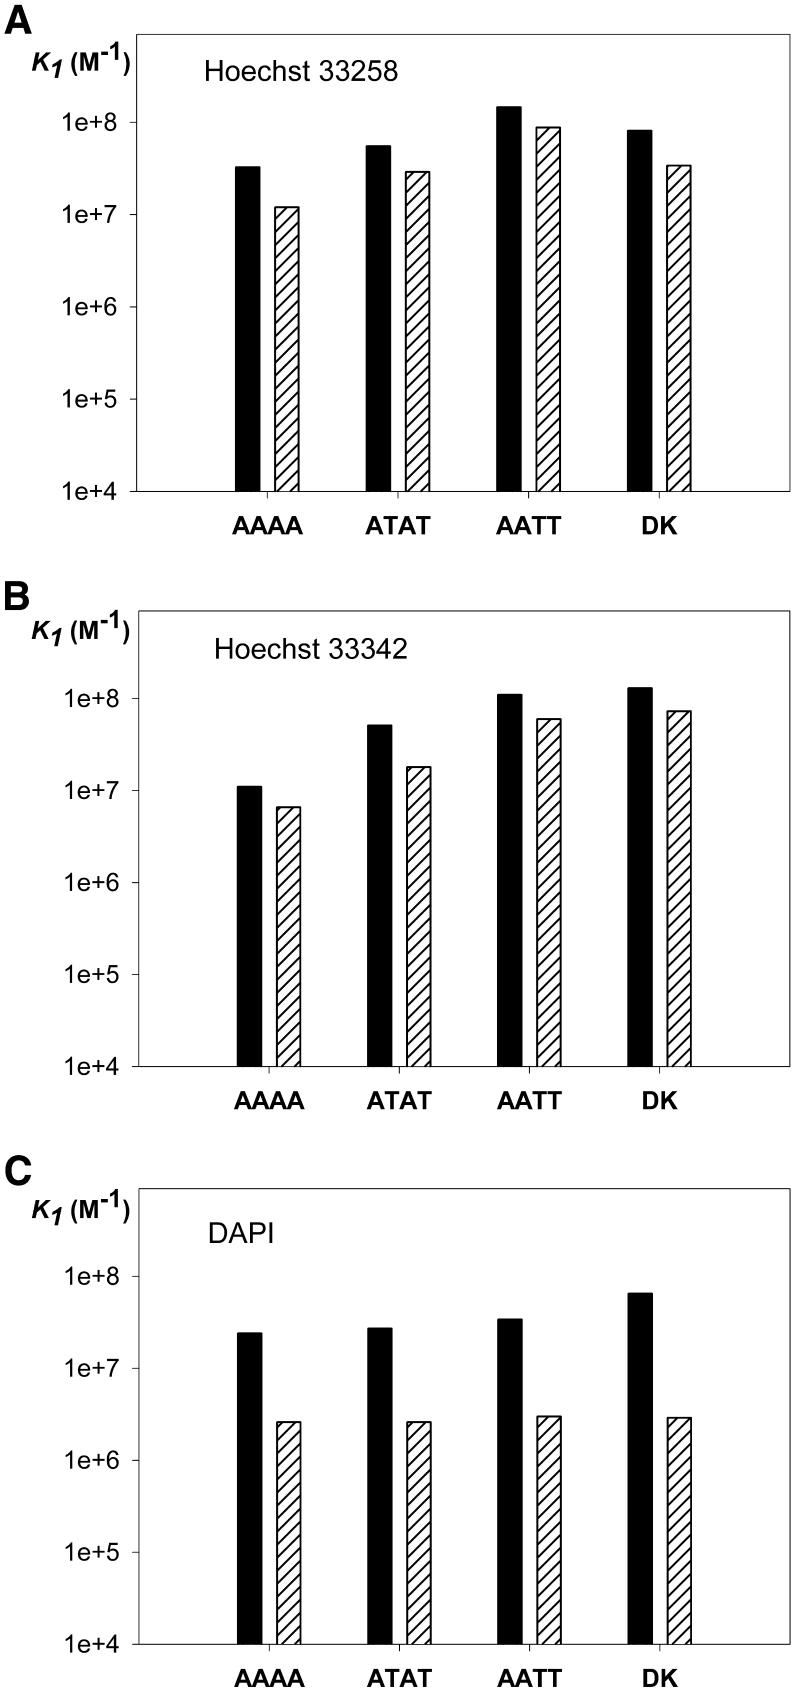
Figure 7.
Comparison between the constants K1 determined by fluorescence titration and fitting of the data with equation 6 (black bars) and the equilibrium association constants K1 determined by electrospray mass spectrometry (hatched bars). Data are shown for each of the fluorescent drugs (A) Hoechst 33258, (B) Hoechst 33342 and (C) DAPI complexed with each of the duplexes.

