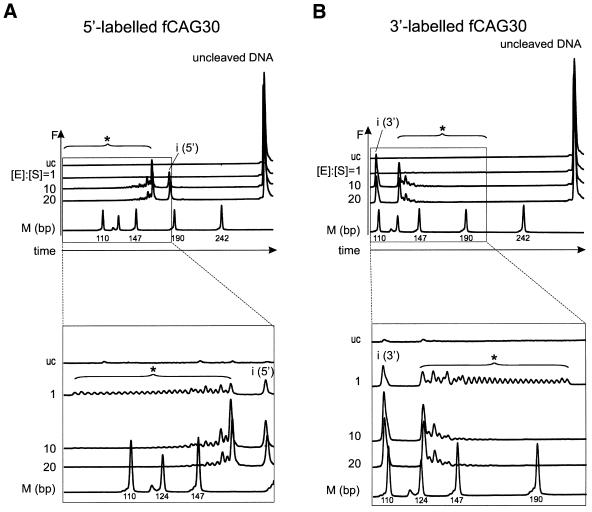
Figure 3.
Analysis of the EcoP15I cleavage pattern of fCAG30 using the ALFexpress DNA Analysis System. DNA substrate fCAG30 was Cy5-labeled either (A) at the 5′-end or (B) at the 3′-end and incubated with EcoP15I at molar ratios of enzyme [E] to DNA substrate [S] of 1, 10 or 20. Cleavage products were separated on non-denaturing 7% (w/v) polyacrylamide gels and analyzed in the ALFexpress DNA Analysis System. Output data show DNA fragments as fluorescence intensity F in arbitrary units. The upper panels show all cleavage products and uncleaved DNA substrate. The lower panels are a close up of the cleavage products. For abbreviations see legend to Figure 1. The molecular weight marker fragments contained two HpaII ends and were therefore Cy5-labeled at both ends. In contrast, fCAG30 was labeled at only one end. As Cy5 is known to change the electrophoretic mobility of DNA fragments (42), the marker could not be used as an absolute but as a relative length standard.

