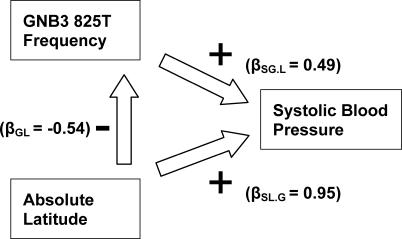
Figure 7. Epidemiologic Model Relating Absolute Latitude and Population-Average GNB3 825T Frequency with Each Other and with Population-Average Systolic Blood Pressure among 35 INTERSALT Populations with Matching Genotype Data.
The β coefficients represent those in the models listed in Table 3.

