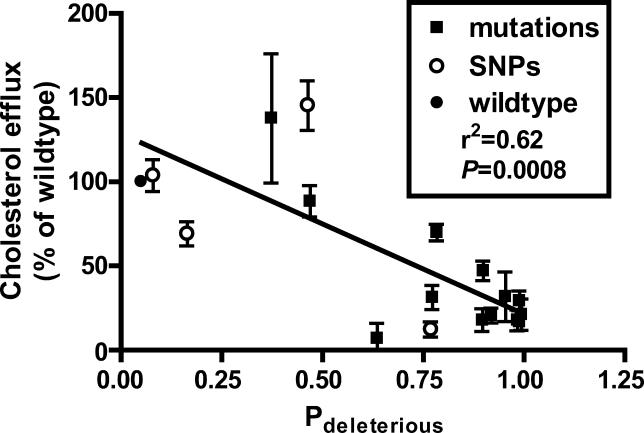
Figure 3. Correlation of Cholesterol Efflux Values with the Probability of a Functional Impairment (Pdeleterious) for ABCA1 Mutations (filled squares) and SNPs (open circles).
PANTHER predictions are significantly correlated with the severity of impairment of ABCA1 mutations (r 2 = 0.62, p = 0.0008) and of all ABCA1 variants (r 2 = 0.56, p = 0.0004). The linear regression shown is for ABCA1 mutations.

