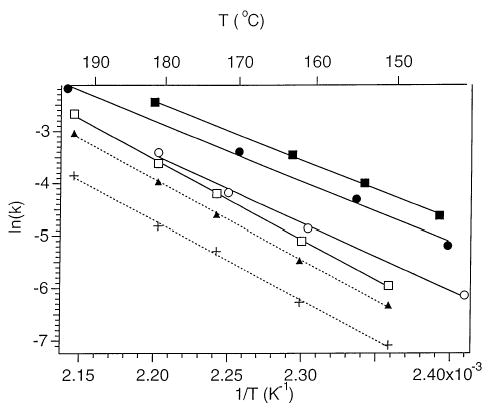
Figure 4.

Arrhenius plots for the loss of neutral adenine from d(AATTAAT)2− (filled circle), d(TTAATTA)2− (open circle), and d(A7)2− (filled square), and for the dissociation of d(CCGGCCG)2− [all processes (open square), loss of neutral cytosine (filled triangle), and the loss of neutral guanine (plus)].
