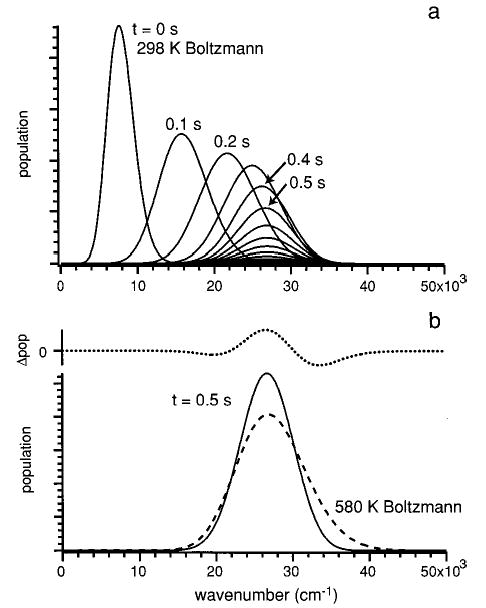
Figure 11.

Calculated ion internal energy distribution of LeuEnk·H+ at 24.1 W laser power. Values of TD* = 1.8 and dCO2 = 8.3 mm were used for the simulation. Part a follows the time evolution of the distribution in 0.1 s time steps. Part b compares the steady-state energy distibution (solid line) to a Boltzmann distribution at 580 K (dashed line). Both curves are normalized to the same area. The difference between these distributions (dotted line) is shown separately.
