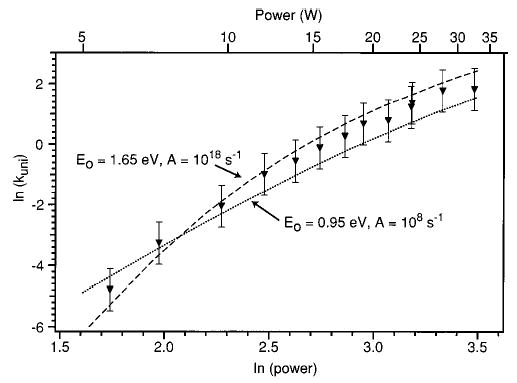
Figure 8.

Experimental (▾) and simulated (dashed and dotted) laser dissociation curves. The threshold dissociation energy (Eo) and Arrhenius A-factor used in the calculations are indicated. Error bars are a factor of 2 in unimolecular dissociation rate constant.
