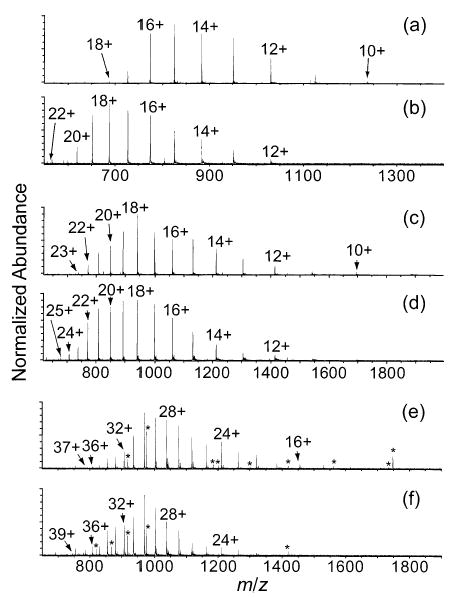
Figure 1.

ESI mass spectra of cytochrome c (a,b), myoglobin (c,d), and carbonic anhydrase (e,f) from 47% water/50% methanol/3% acetic acid solutions with (b,d,f) and without (a,c,e) 0.5% m-nitrobenzyl alcohol. Peaks denoted by asterisks are charge states of an impurity of mass 15 599 Da, except for those at m/z 1186 and 1748, which are charge states of impurities of mass 8298 and 15 724 Da, respectively.
