
Figure 10.
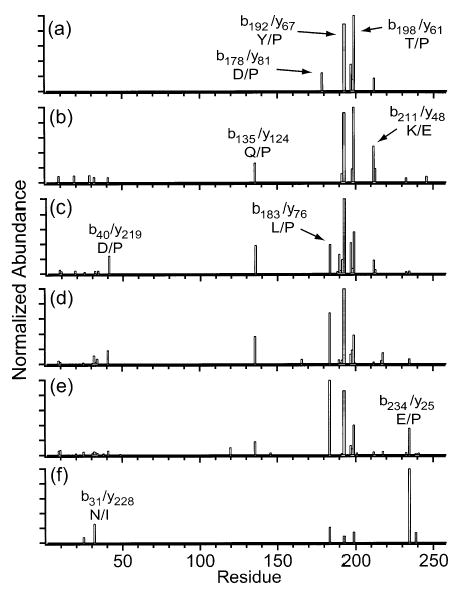
Summed y- and b-ion plots resulting from fragmentation of the (a) 16+, (b) 20+, (c) 24+, (d) 28+, (e) 32+, and (f) 36+ charge states of carbonic anhydrase.
Official websites use .gov
A
.gov website belongs to an official
government organization in the United States.
Secure .gov websites use HTTPS
A lock (
) or https:// means you've safely
connected to the .gov website. Share sensitive
information only on official, secure websites.
Summed y- and b-ion plots resulting from fragmentation of the (a) 16+, (b) 20+, (c) 24+, (d) 28+, (e) 32+, and (f) 36+ charge states of carbonic anhydrase.