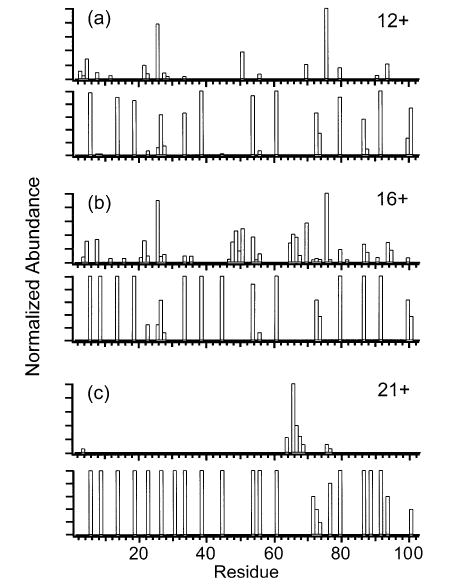
Figure 11.

Comparison of the summed y- and b-ion plots with the frequencies of protonating individual residues of the (a) 12+, (b) 16+, and (c) 21+ charge states of cytochrome c. For each charge state, the summed y- and b-ion plot is shown above the corresponding protonation frequency plot. The frequencies of protonating residues are from ref 52.
