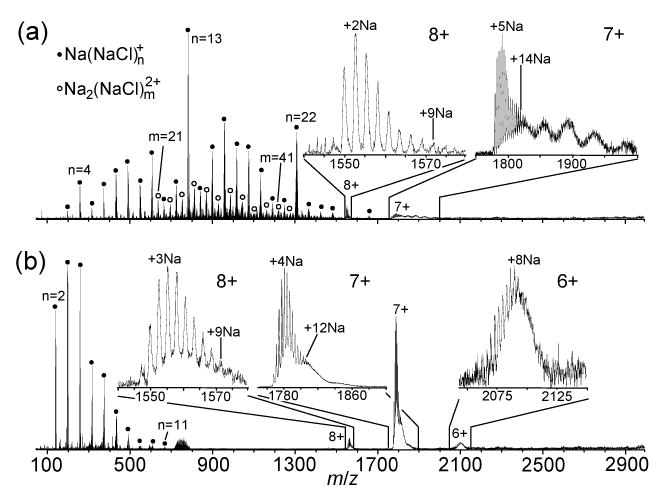
Figure 2.

ESI mass spectra of cytochrome c (10−5 M) ions formed from aqueous solutions containing 2.0 × 10⁻² M sodium chloride and (a) 0 or (b) 7 M ammonium acetate. Cluster ions Na(NaCl)n+ and Na2(NaCl)m2+ are indicated by closed circles and open circles, respectively.
