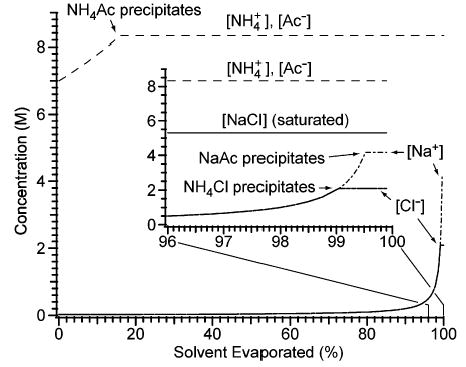
Figure 4.

Evolution of the solution-phase concentrations of NH4+, Na+, acetate (Ac−), and Cl− during the evaporation of an aqueous solution that initially contains 2.0 × 10⁻² M NaCl and 7 M NH4Ac. The inset shows detail for 96–100% of solvent evaporated. For comparison, the solubility of sodium chloride, 5.3 M, is represented by a solid line, labeled “[NaCl] (saturated)”, in the inset. The plot is based on equilibrium data from refs 40 and 41.
