
Figure 5.
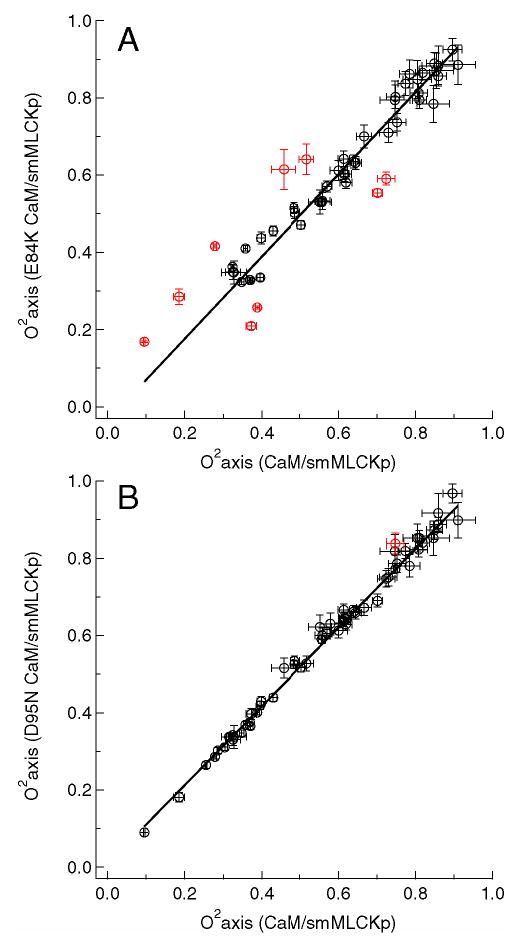
Methyl axis order parameters, , of the E84K-smMLCKp (A) and D95N-smMLCKp (B) complexes versus those of the wild-type CaM-smMLCKp complex. The least median squares (LMS) fit is shown with a solid line. Outliers identified by the LMS analysis are colored red. The value of the intercept was not forced to zero in the LMS analysis to account for possible systematic differences caused by the uncertainties in global correlation time. Since the average value of the is the same for all mutant and wild-type complexes within the experimental error, forcing the constant to zero produced an essentially identical set of outliers.