
Figure 6.
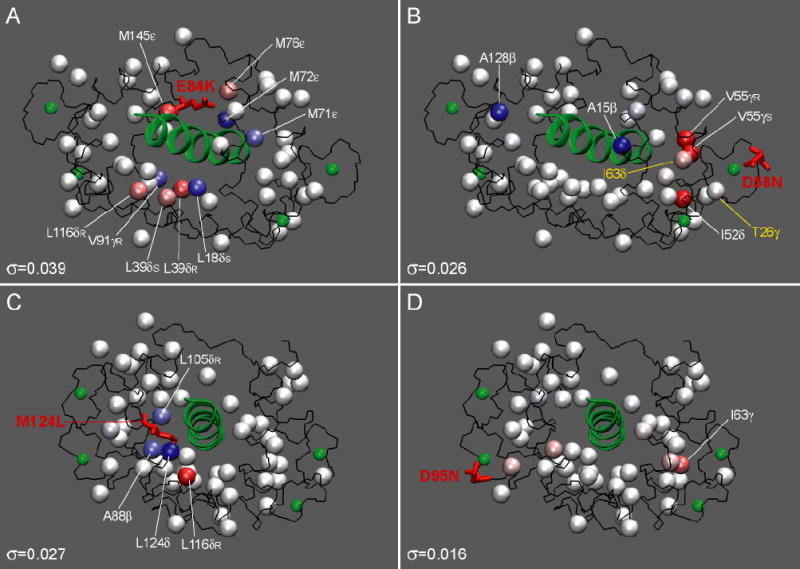
Standardized residuals mapped onto the three-dimensional structure of CaM-smMLCKp (PDB code 1cdl) using a blue-white-red color gradient to represent the range of from −5.0σ to +5.0σ. The values of scale estimate σ are given at the bottom of each panel. Mutated residues are shown in stick representation and are labeled. The peptide structure and calcium atoms are displayed in green. In C, the value of L124δ is mapped onto the Cɛ carbon of M124 using an average for the two methyl groups of L124. The individual values for the two L124 methyl groups are given in Table 1. In D58N-smMLCKp, two methyl groups with perturbed τe are shown in yellow.