Fig. 1.

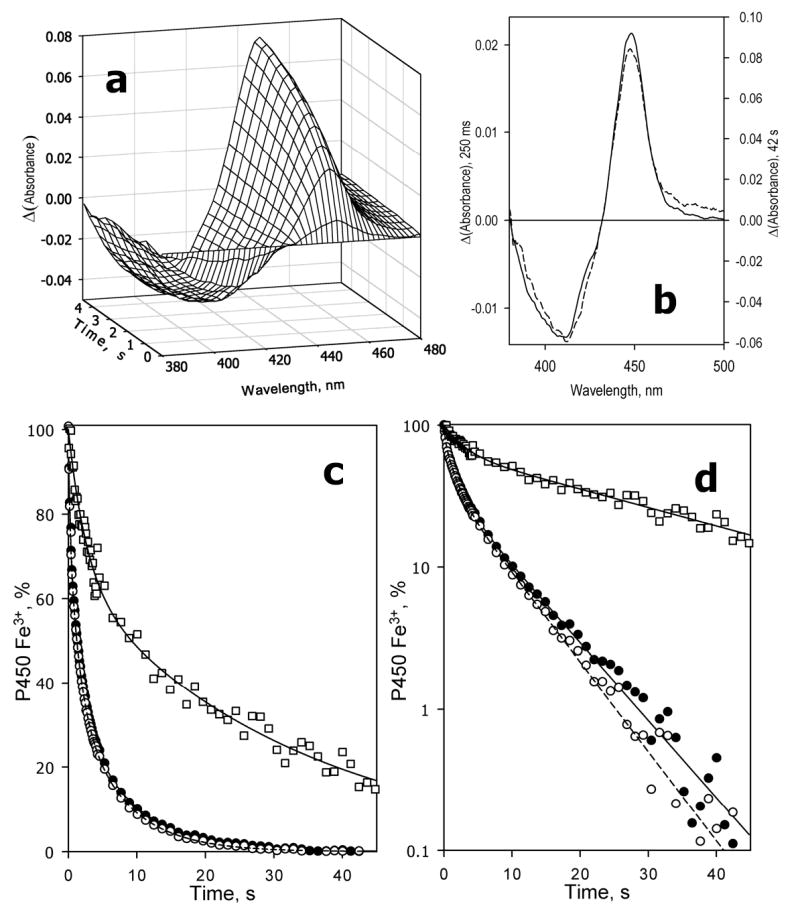
Kinetics of dithionite-dependent reduction of CYP3A4 in oligomers in solution. Conditions: 3 μM 3A4, 12.5 mM sodium dithionite, CO-saturated 0.1 M Na-Hepes buffer, pH 7.4, 1 mM DTT, 1 mM EDTA, 1 mM protochatechuic acid, 0.1 U/mL protocatechuate dioxygenase, 25 °C. Spectra recorded in a stop-flow cell with 5 mm optical path length. a: Changes in absorbance in the Soret region during the initial 5 seconds of reaction. The first spectrum shown corresponds to the time of 60 ms after mixing, and the following spectra were taken in 400 ms time intervals. The spectrum measured at time of origin is subtracted. b: The difference spectra of reduction measured at 250 ms (dashed line) and 42 s (solid line) after mixing. The spectra are scaled by linear least squares algorithm to have similar amplitudes in the graph. c,d: Kinetics of reduction of the total pool (filled circles, solid line), low-spin (empty circles, dashed line) and high-spin (squares, solid line) of CYP3A4 in linear (c) and semi-logarithmic (d) coordinates. The lines show the results of the fitting of the data to the equation of the sum of three (total heme protein and the low-spin fraction) or two (high-spin fraction) exponents. The data were scaled according to the fitting results to represent a percent decrease in the content of the respective states of the ferric enzyme.
