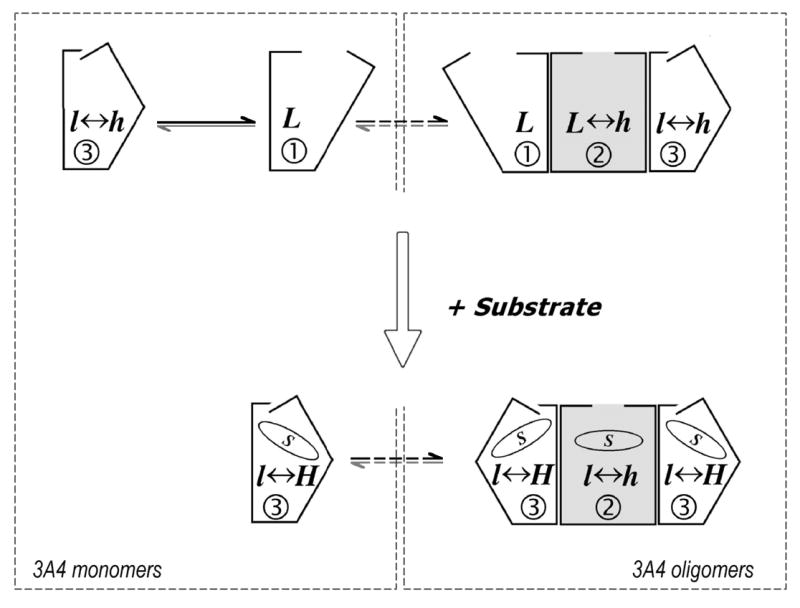
Fig. 11.

A suggested scheme of conformational transitions and oligomerization in CYP3A4, which explains the heterogeneity of the enzyme observed in the kinetics of dithionite dependent reduction. The whole scheme represents the situation expected in protein-rich liposomes and in microsomes. The left dashed rectangle outlines the transitions taking place in a monomeric system, such as CYP3A4 incorporated into Nanodiscs and the enzyme in lipid-rich liposomes. The right rectangle outlines the states observed in the oligomer in solution. Encircled digits symbolize the phase of the total hemeprotein reduction corresponding to each conformational state of the enzyme. Letters “L” and “H” symbolize high- and low-spin states of P450 respectively and the displacement of spin equilibrium in each of P450 conformations is symbolized by capitalization of these letters. Dashed arrows show slow transitions between monomeric and oligomeric states.
