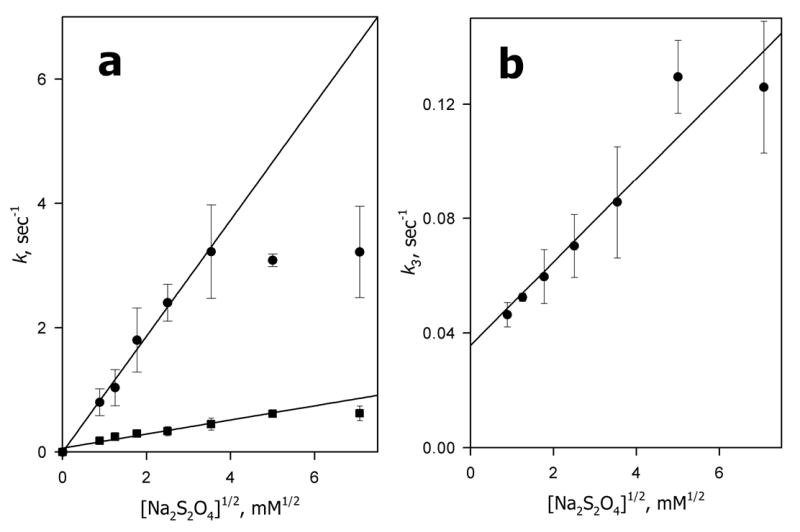
Fig. 2.

Dependence of the pseudo-first order rate constants of CYP3A4 reduction on the square root of dithionite concentration. Panel a shows the dependencies for k1 (circles) and k2 (squares). Data for k3 are shown in panel b. The points shown correspond to averages of 3–6 measurements. Error bars represent the confidence interval (p = 0.05). Concentrations of dithionite varied from 0.78 to 50 mM. Other conditions as indicated in Fig. 1.
