
Fig. 8.
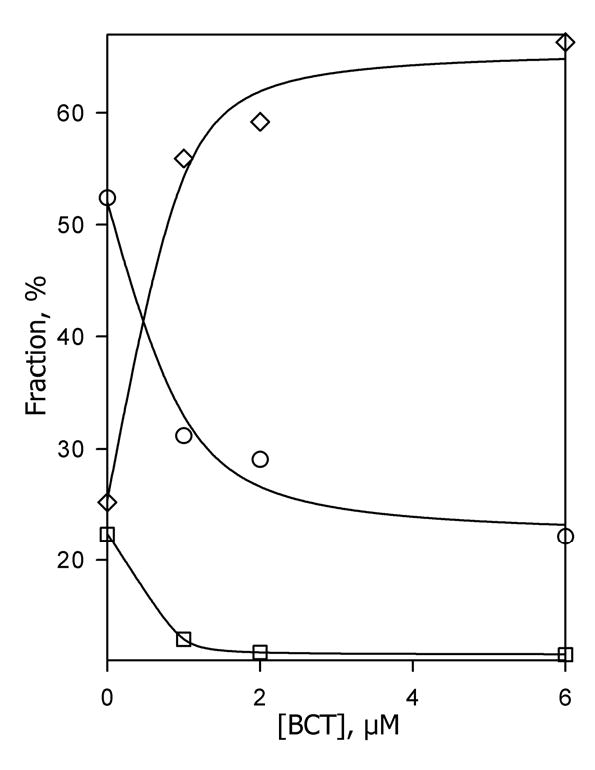
Effect of bromocriptine on the kinetics of reduction of CYP3A4 in P450-rich proteoliposomes (Sample I). The fractions of the fast phase (F1, circles), middle phase (F2, squares) and the slow phase (F3, diamonds) plotted versus bromocriptine concentration. Lines represent the results of fitting of the respective data sets to the equation for the equilibrium of binary association. The values were obtained from the fitting of the kinetic curves of dithionite-dependent reduction of 3 μM suspension of the P450-rich liposomes (Sample I). Other conditions as indicated in Fig. 3.