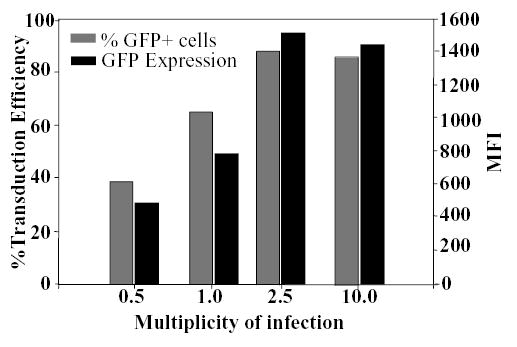
Figure 3. Optimization of retrovirus transduction of mouse epidermal cultures.

Cultured murine epidermal cells were transduced with LZRS-GFP at MOIs indicated at the bottom of the figure. Three days post-transduction, GFP expression was determined by FACS. The percent GFP positive cells in each population indicated transduction efficiency (gray bars) and the mean fluorescent intensity (MFI) indicated the levels of GFP expression (black bars).
