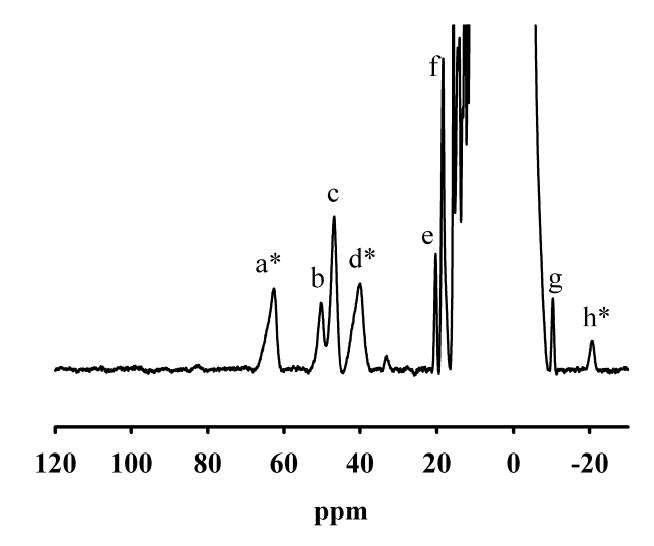
Fig. 3.

NMR spectrum of 1.6 mM GLX2-5. NMR spectra were collected on a Bruker Avance 500 spectrometer operating at 500.13 MHz, 298 K, and a magnetic field of 11.7 T, recycle delay (AQ), 41 ms; sweep width, 400 ppm. Protein chemical shifts were calibrated by assigning the H2O signal the value of 4.70 ppm. A modified presaturation pulse sequence (zgpr) was used to suppress the proton signals originating from water molecules.
