
Figure 3.
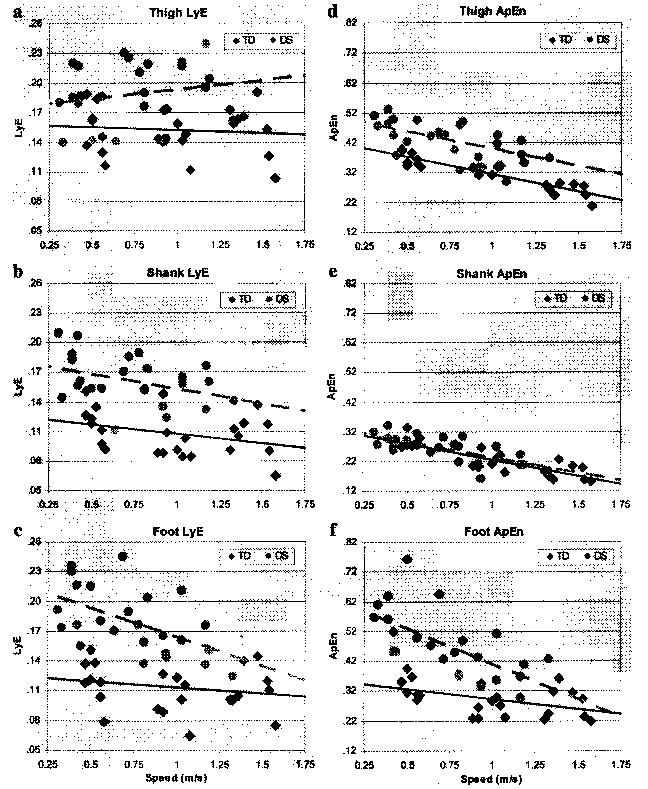
Scatterplots of (left column) Lyapunov exponent (LyE) and (right column) approximate entropy (ApEn) for all values for all segments for children with Down syndrome (DS) and typical development (TD) at each treadmill walking speed. Dashed (—) and solid lines (—) represent linearly regressed line of best fit for children with DS and TD, respectively (y = mx + b).