
Figure 3.
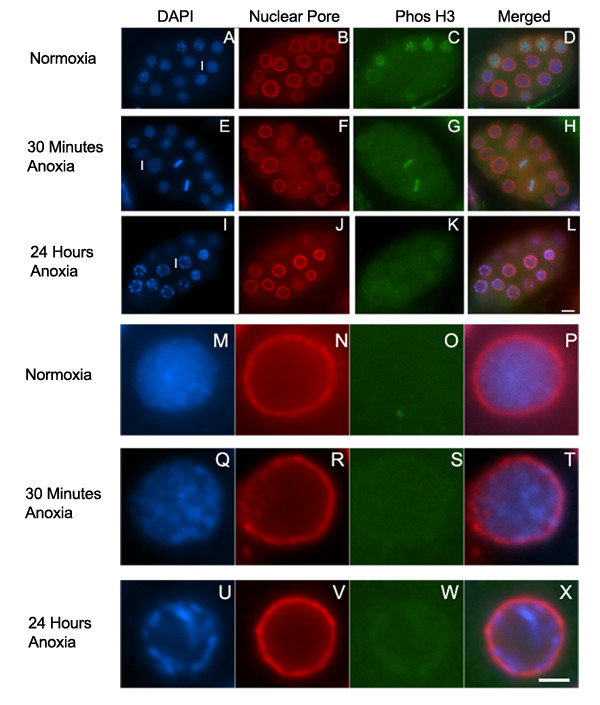
Chromosomes of interphase blastomeres exposed to anoxia condense and align near the nuclear membrane. Embryos were exposed to either normoxia (A-D, M-P), 30 minutes of anoxia (E-H, Q-T), or 24 hours of anoxia (I-L, U-X), collected, and stained with DAPI (A, E, I, M, Q, U), the mAb414 to recognize nuclear pore complex (B, F, J, N, R, V), and PhosH3, which recognizes phosphorylated Histone H3 (C, G, K, O, S, W). Images were merged (D, H, L, P, T, X) to analyze chromosome location relative to the nuclear membrane. In figures A, E, F, letter I is to the left of the interphase blastomere enlarged and shown in figures M-X respectively. Scale bar equals 5 μM for images A-L and 2 μm for images M-X.