
Figure 6.
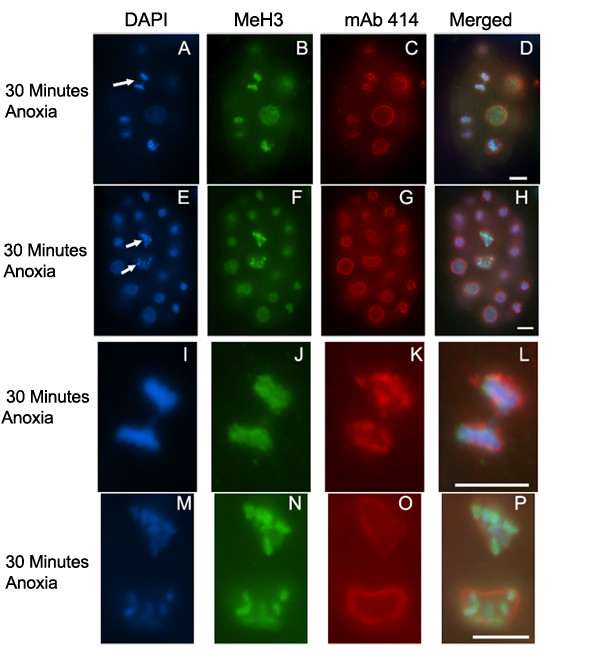
san-1(RNAi) embryos exposed to 30 minutes of anoxia display chromosome segregation abnormalities. Two representative embryos that were exposed to 30 minutes of anoxia and stained with DAPI (A, E, I, M), antibody MeH3, which recognizes methylated Histone H3 (B, F, J, N), and mAb414 to detect the nuclear pore complex (C, G, K, O). Merged image for each set is shown (D, H, L, P). Arrows point to representative anaphase bridging (A) and abnormal chromatin structure (E) with the enlarged images shown in I-L and M-P, respectively. Scale bar equals 5 μm.