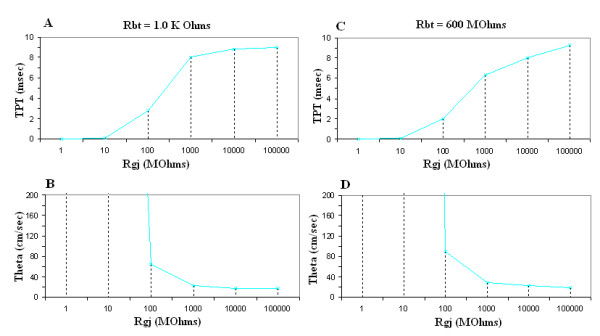
Figure 5.

Graphic summary of the total propagation time (TPT) (A, C) and propagation velocity (θ, theta) (B, D) as a function of the shunt resistance across the 9 cell junctions (Rgj). The data for a strand termination resistance (Rbt) of 1.0 KΩ (A, B) and 600 MΩ (C, D) are given in separate plots. TPT was the time difference between when the AP of cell #1 and cell #10 crossed a Vm of -20 mV. The velocity (θ) was calculated from the TPT, assuming a cell length of 200 μm. Assuming the conductance of the gj-channel is 100 pS, the Rgjvalues shown of 1.0, 10, 100, 1,000, 10,000, and 100,000 MΩ correspond to the number of gj-channels of 10,000, 1,000, 100, 10, 1.0 and 0.
