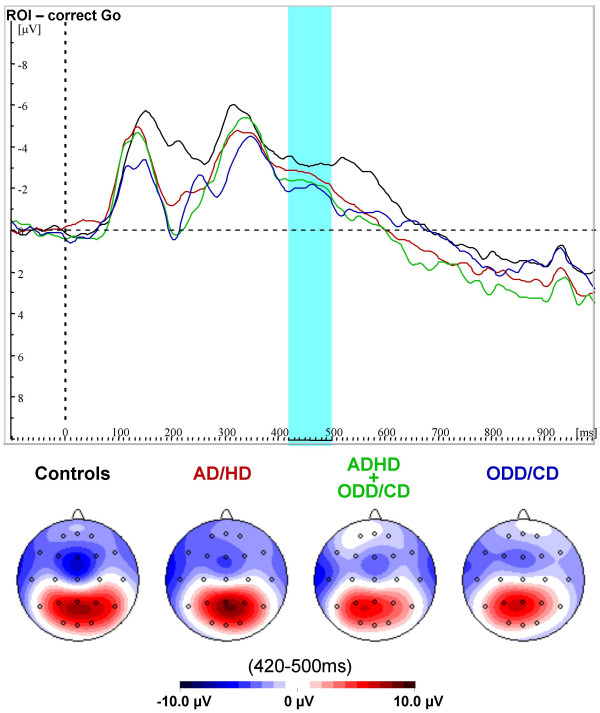
Figure 2.
ERPs for correct Go-trials. Grand-average waveshapes from the region of interest (F4/F8), and spline-interpolated maps for correct Go-trials for normal controls (black), AD/HD (red), AD/HD+ODD/CD (green) and ODD/CD (blue). There were no group-differences and no negative peaks in the region and time window of interest.

