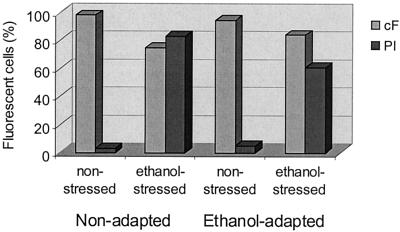
FIG. 6.
Effect of ethanol on fluorescence labeling of O. oeni with fluorescent probes. Cells were stressed with 16% (vol/vol) ethanol for 25 min, washed with potassium phosphate buffer (pH 7), and labeled in the same buffer at 30°C. PI exclusion and cF retention were analyzed by flow cytometry in nonadapted and 8% (vol/vol) ethanol-adapted cells.

