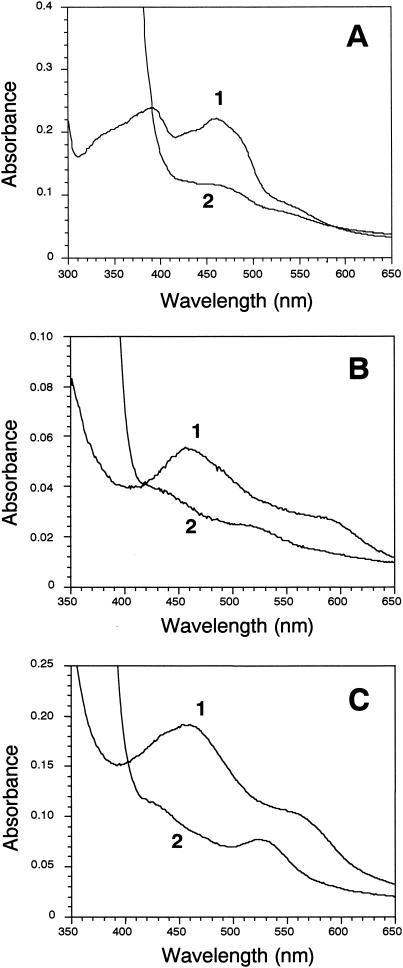
FIG. 1.
UV-visible absorption spectra of His-tagged CarAd (A), His-tagged CarAc (B), and CarAa (C). In panel A, curve 1 shows the oxidized spectrum of His-tagged CarAd (10 nmol) in 1.0 ml of 50 mM Tris-HCl buffer (pH 8.0) under anaerobic conditions, and curve 2 shows the spectrum after the addition of NADH (0.5 μmol). In panel B, curve 1 shows the oxidized spectrum of His-tagged CarAc (10 nmol) in 1.0 ml of 50 mM Tris-HCl buffer (pH 7.0) under anaerobic conditions, and curve 2 shows the spectrum after the addition of NADH (0.5 μmol) and a catalytic amount of His-tagged CarAd (0.2 nmol). In panel C, curve 1 shows the oxidized spectrum of CarAa (10 nmol) in 1.0 ml of 50 mM Tris-HCl buffer (pH 7.0) under anaerobic conditions, and curve 2 shows the spectrum after 10 min from the addition of His-tagged CarAc (0.2 nmol), His-tagged CarAd (0.2 nmol), and NADH (0.5 μmol) (fully reduced CarAa).

