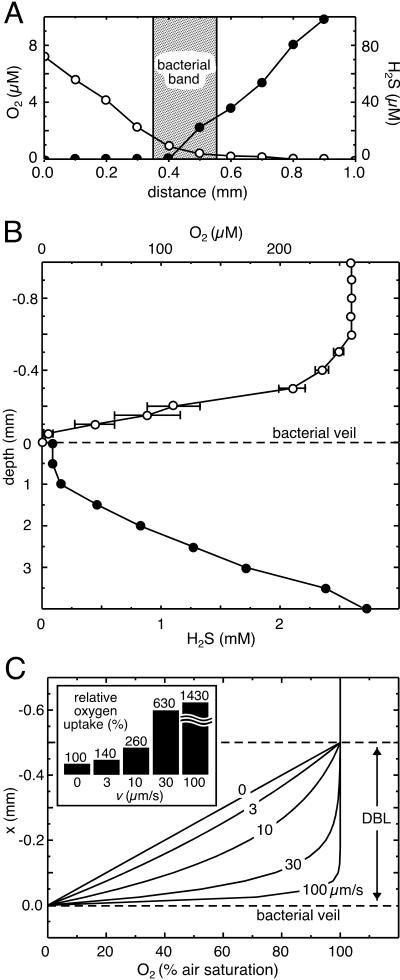
FIG. 6.
(A) Oxygen (○) and sulfide (•) gradients across a bacterial band within a flat glass capillary. The shaded region indicates the position of the band. (B) Oxygen (○) and sulfide (•) gradients across a bacterial veil formed on top of benthic gradient chamber. The error bars (where present) indicate the standard deviation (n = 2). Note the changing depth scale. (C) Effect of bacterially induced downward water flow on oxygen gradients within the DBL above a whitish translu-cent veil. Model calculations of oxygen gradients are shown for different downward flow velocities, which are indicated by the adjacent numbers. x represents the distance to the veil. (Inset) Relative oxygen uptake rates at the veil surface calculated for different downward flow velocities (v).

