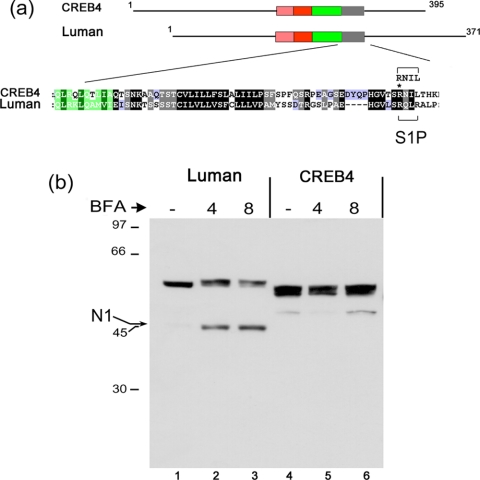
Figure 6.
CREB4 resistance to brefeldin A-induced cleavage. (a) Selective comparison of Luman and CREB4 and alignment of regions IV and V as discussed in the text. The position of a single R>G substitution (see Figure 9) is indicated by an asterisk. (b) Cells were transfected with expression vectors for Luman, CREB4, or CREB4.ΔN1, and 24 h later they were treated with brefeldin A (1 μg/ml) 4 or 8 h, or left untreated (-). The cells were then harvested and samples separated by SDS-PAGE and analyzed by Western blot analysis using the anti-epitope SV5 antibody. An arrow indicates the position of the induced cleavage product of Luman (N1). Very minor low levels of an N-terminal product of CREB4 are indicated, but these were not reproducibly observed (see, e.g., Figures 8 and 9) and importantly were not affected by brefeldin A treatment.

