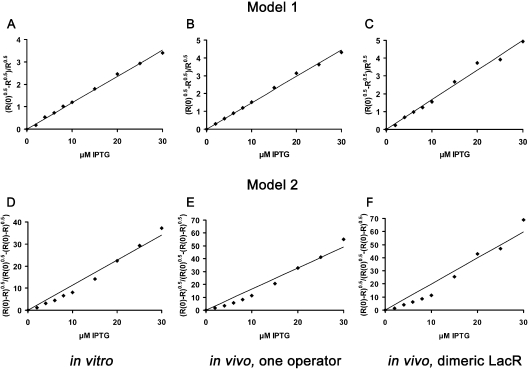
Figure 4.
The functional inducer-binding stoichiometry of Lac repressor. Substituting [Dt]/Ko with R(0), the experimental data are transformed using linearizing rearrangements of Equation 3 (Model 1: (R(0)0.5 − R0.5)/R0.5 = ) and 4 (Model 2: (R(0) − R)0.5/(R(0)0.5 − (R(0) − R)0.5) = ). Best fit straight lines were derived by linear regression. All plots are of non-cooperative systems. (A) In vitro, model 1. (B) In vivo, model 1. The lac promoter is controlled by wt tetrameric Lac repressor and the first lac operator only. (C) In vivo, model 1. The lac promoter is controlled by dimeric active Lac repressor and all three lac operators. (D) In vitro, model 2. (E) In vivo, model 2. The lac promoter is controlled by wt tetrameric Lac repressor and the first lac operator. (F) In vivo, model 2. The lac promoter is controlled by dimeric active Lac repressor and all three lac operators.

