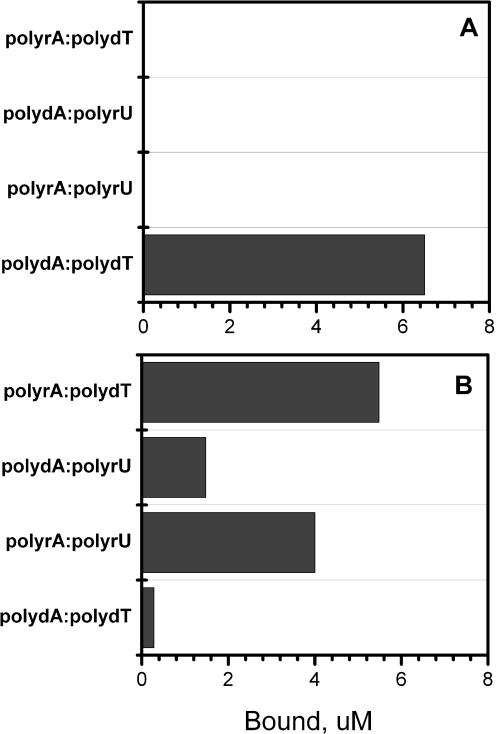
Figure 5.
Results of competition dialysis experiments. The amount of netropsin (A) or EB (B) bound to each structure is shown as a bar graph. Nucleic acid samples (200 µl at identical concentration of 75 µM bp) were dialyzed against 200 ml dialysate containing 1 µM ligand. The experiments were carried out in BPES buffer consisting of 6 mM Na2HPO4, 2 mM NaH2PO4, 1 mM Na2EDTA and 0.185 M NaCl (pH 7.0).

