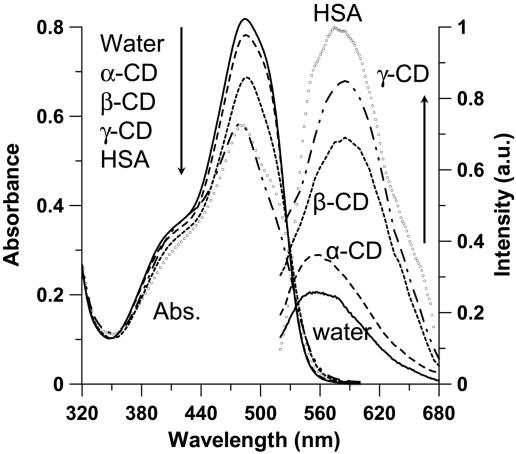
Fig. 2.
UV-visible absorption (Left) and emission (Right) spectra of OII in water (solid line) and in presence of 15 mM α-CD (dashed line), β-CD (dotted line), γ-CD (dash-dot line), and 20 μM HSA protein (open circles). For clarity, the HSA emission spectrum was multiplied by 0.05. The excitation wavelength was 390 nm.

