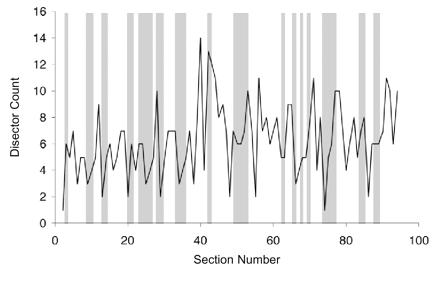
Figure 11 .

The distribution of disector counts through the reference volume. Each pair of sections in the series represents a disector of one section thickness. The solid line shows the count (Q–) obtained for each such disector. The gray bars show the random selection of 33 of the disectors for estimation of synaptic density.
